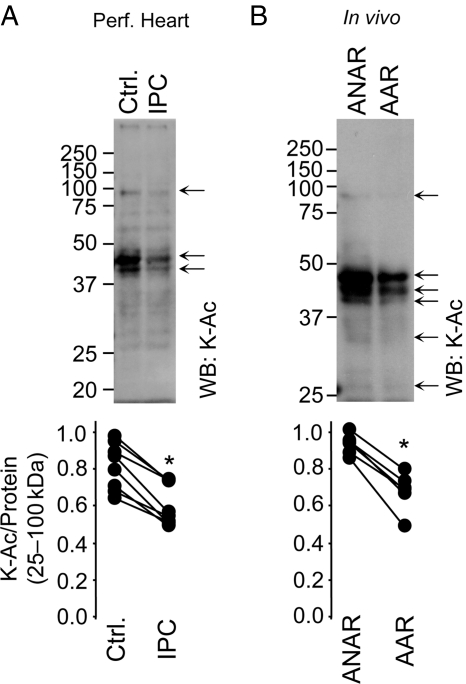
Figure 1.
Protein acetylation during IPC in perfused and in vivo mouse heart. (A) Mouse hearts were subjected to either control perfusion (Ctrl.) or IPC (without subsequent IR injury) followed by immediate tissue fractionation. (B) Mice were subjected to in vivo IPC (without subsequent IR injury). The AAR was separated from the ANAR followed by tissue fractionation. In both panels, protein fractions were separated by SDS–PAGE and K-Ac visualized by western blot. Representative blots for cytosolic fractions are shown, with other cell fractions in Supplementary material online, Figure S1. Molecular weight markers (kDa) are to the left of blots. Arrows highlight differences in protein acetylation between control and IPC groups. Panels below show densitometry in the range 25–100 kDa, normalized to protein across the same molecular weight range (representative Ponceau S stained membranes are in Supplementary material online, Figure S1). Each pair of data points connected by a line represents a single experiment. The ratio of K-Ac/Protein was calculated and presented for each individual experiment. *P < 0.05 (paired Student's t-test) between control and IPC groups, n ≥ 5.

