Figure 2.
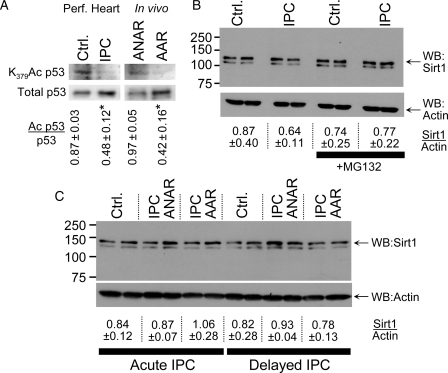
p53 acetylation and SIRT1 protein level during IPC in perfused and in vivo mouse heart. (A) Homogenates from perfused hearts subjected to control perfusion (Ctrl.) or IPC were western blotted for p53 lysine 379 acetylation (left upper panel) and total p53 (left lower panel). Homogenates from AAR and ANAR of hearts exposed to IPC in vivo were also blotted. The ratio of Ac p53/p53 was calculated by densitometry and is shown below the blots (mean ± SEM, n ≥ 3). *P < 0.05 (paired Student's t-test) between control and IPC. (B) Homogenates from perfused hearts were obtained as described above, and western blotted for SIRT1 (upper panel) or actin (lower panel). Where indicated, the proteasome inhibitor MG132 was present during sample preparation. The ratio of SIRT1/actin was calculated by densitometry and is shown below the blots (mean ± SEM, n ≥ 4). (C) Mice were subjected to IPC in vivo, and heart tissue harvested from the AAR or ANAR either immediately (i.e. acute IPC), or 24 h later (i.e. delayed IPC). Heart homogenate was western blotted for SIRT1 (upper panel) or actin (lower panel). The ratio of SIRT1/actin was calculated by densitometry and is shown below the blots (mean ± SEM, n ≥ 4). This SIRT1 antibody yields two bands on a western blot, and the literature consensus is that the upper band is SIRT1 whereas the lower is of unknown origin.66 Loading controls (representative Ponceau S stained membranes) for all blots are shown in Supplementary material online, Figure S5.

