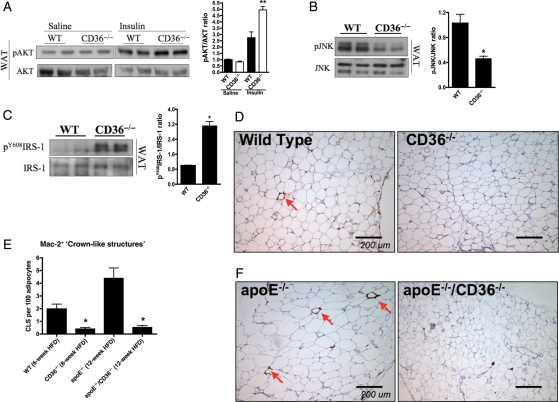
Figure 2.
CD36 contributes to inflammation and macrophage infiltration in adipose tissue after HFD. In vivo insulin signalling assay of AKT phosphorylation in (A) WAT of 8-week HFD CD36−/− vs. WT mice. Representative immunoblots (left) and quantification (right) of (B) JNK phosphorylation and (C) IRS-1 tyrosine phosphorylation from WAT of 8-week HFD mice. (D, F) MAC-2 staining of representative WAT sections from HFD mice, and (E) quantification of CLS (arrows) expressed as a percentage of CLS/100 adipocytes averaged from four separate fields. *P < 0.05; **P < 0.01 vs. WT; n ≥ 5 per group.

