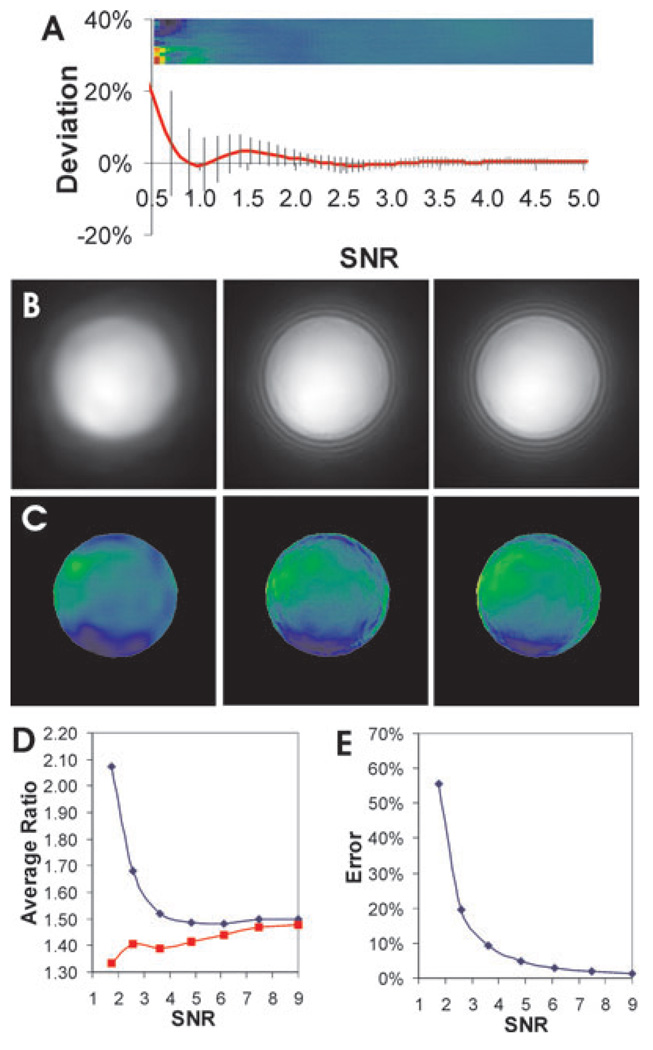
Fig. 6.
Restoration of ratio images with a statistically based multi-resolution filter. Noisy grey scale (A) or bead images (B–C) are processed with the BLS-GSM multi-resolution filter before taking the ratio. The relative systematic error, shown in Fig. 4(A) before denoising, is reduced dramatically to about 5% at SNR ~0.7, without introducing noticeable artefact (A). Vertical lines indicate the standard deviation, which remains <10% for SNR >1. Denoising of the denominator bead images, with an SNR of 2.6, 6.1 or 11, respectively, in the bead area before denoising (Fig. 3B), removes all the visible fine fluctuations in intensity across the surface (B). Although the ratio image is highly dependent on SNR before denoising (Fig. 3C and D, blue line), the ratio becomes nearly independent of initial SNR after denoising (D, red line). In addition, the ratio image shows no visible artefacts (C). Pseudo-colour rendering is performed according to the colour scale shown in Fig. 3. The slight non-uniformity in ratio across the bead surface is due to the shift in focal plane between the two wavelength channels. The slight increase in ratio with increasing SNR is due to the increase in lamp colour temperature. Noise-induced systematic error in image ratio may be estimated by dividing the ratio obtained with or without denoising (E). The dependence of error on SNR is similar to the predictions shown in Fig. 2.

