
Figure 1.
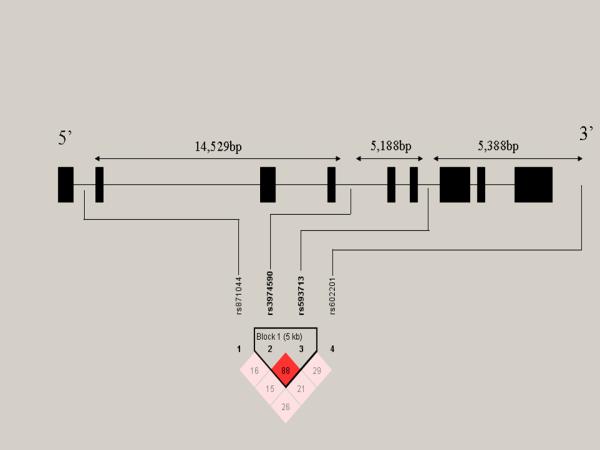
Linkage disequilibrium measures (D’) across the MPPE1 gene. From left to right, the SNPs are aligned from 5′ to 3′. Black boxes represent exons. LD patterns and haplotype blocks were defined by the “solid spine of LD” using the Haploview software. A standard color scheme is used to display LD pattern, with dark red for very strong LD, white for no LD, and shades of red for intermediate LD. Increasing intensity of red indicates increasing degrees of LD.