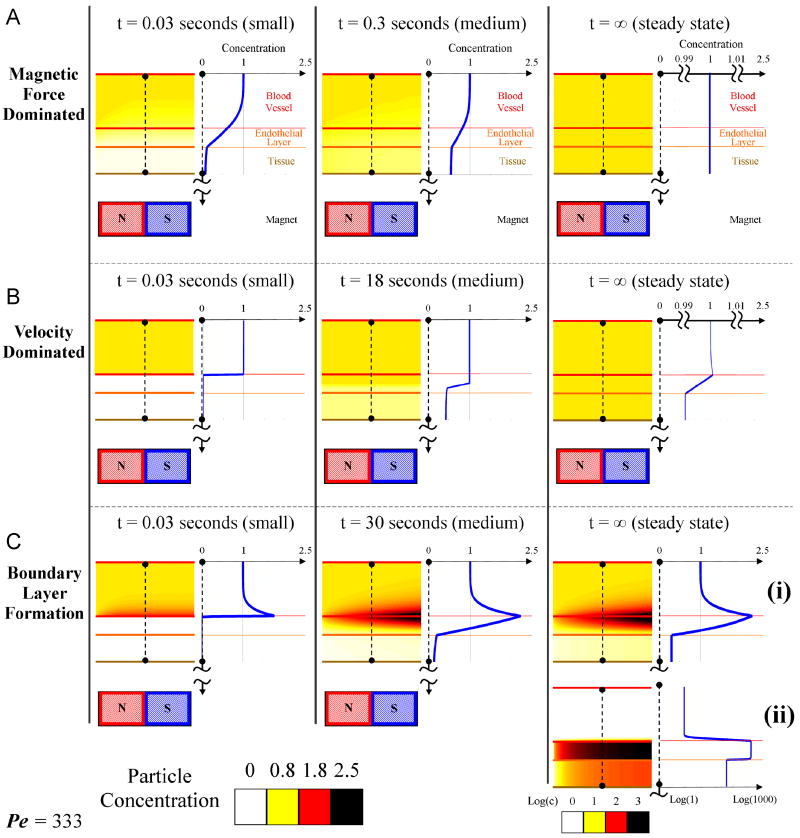
Figure 4.
The three prototypical behaviors: A) magnetic force dominated case (Ψ = 10-3,  = 1), B) velocity dominated case (Ψ = 10-5,
  = 10-3), and C) boundary layer formation (Ψ = 10-2,
  = 10-3). (A) The magnetic force dominated case shows a cross-sectional concentration of the magnetic nano-particles for three times at t = 0.03 seconds (early), 0.3 seconds (middle), and at equilibrium, at Pe = 333. Particles are pulled towards the magnet and out through the bottom of the tissue resulting in a constant concentration equal to the blood inlet concentration. Here the tissue diffusion is set to equal the diffusion in the endothelial membrane. (B) Velocity dominated shows a cross-sectional concentration of the magnetic nano-particles for three times at t = 0.03 seconds (early), 18 seconds (middle), and at equilibrium, at Pe = 333. Particles are washed out before they generate a significant boundary layer along the vessel wall. At long times diffusion equilibrates the concentration between tissue and blood. Here the tissue Renkin number is set at
  = 10
= 10  which means it is ten times as easy for particles to diffuse through tissue than through the endothelial membrane. (C) Boundary layer formation shows a cross-sectional magnetic nano-particle concentration for three times at t = 0.03 seconds (early), 30 seconds (middle), and at equilibrium, at Pe = 333. (i) The steady state profile for Ψ = 10-2. Here the particle concentration is shown on the same linear scale as in other time snap shots. (ii) The steady state profile for a higher magnetic-Richardson number, for Ψ = 10-1. Here both the particle conentration and the cross-sectional plot are shown on a log scale. In both boundary layer cases (Ψ = 10-2 and 10-1) the particles build-up along the vessel membrane on both the vessel side and within the membrane. The boundary layer forms very rapidly. In (ii) the membrane particle concentration is sufficiently high to cause a concentration in the tissue greater than the vessel inlet concentration. In both (i) and (ii) the tissue Renkin number is set at
  = 10
= 10  which means it is ten times as easy for particles to diffuse through tissue than through the endothelial membrane.

