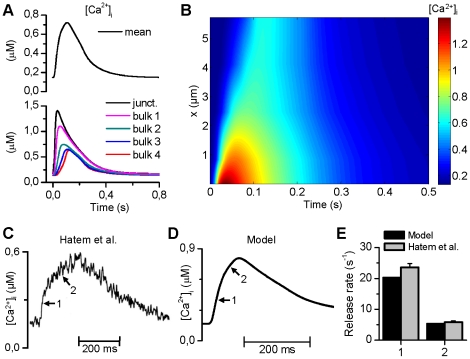
Figure 3. Ca2+ dynamics of the model.
(A) The Ca2+ transients at different parts of the cytosol differ from the average cytosolic Ca2+ signal. The x-coordinates of the compartments are as follows: subspace 0.01 µm, bulk1 = 0.8325 µm, bulk2 = 2.4575 µm, bulk3 = 4.0825 µm, and bulk4 = 5.7075 µm; SL = 0 µm. (B) Spatiotemporal representation of [Ca2+] demonstrates clearly the divergence of both the amplitude and delay of Ca2+ release in different parts of the cytosol. (C) and (D) The model reproduces the experimentally found biphasic increment during the upstroke of the global Ca2+ transient [7]. (E) Release rates of the two phases of the Ca2+ transient in experiments by Hatem et al. [7] and simulations. The two values of release rates (arrows in (C) indicate the stages of release) were obtained with a linear fit to normalized Ca2+ transients.

