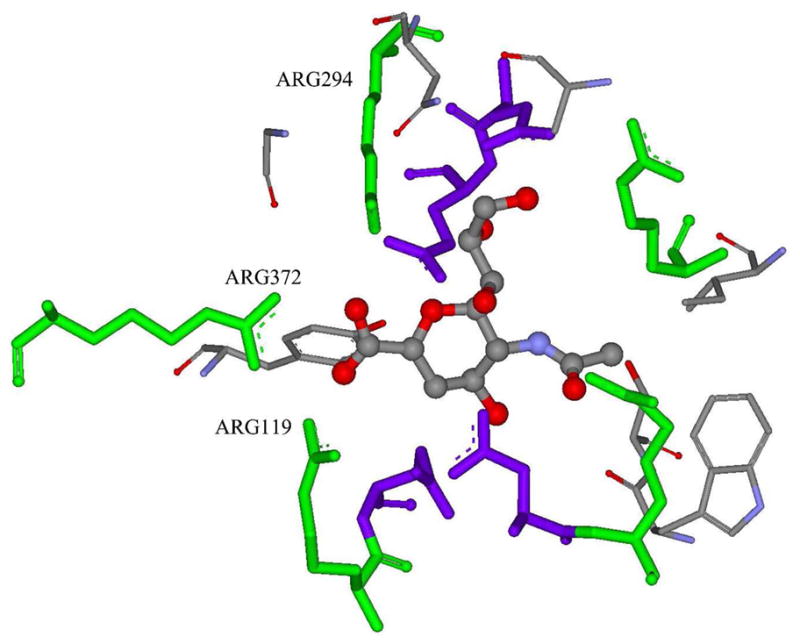
Figure 2.

The 3-D structure of the neuraminidase binding site. The ligand d1 is shown in ball-and-stick representation, the Arg residues are shown in green stick representation, and the Glu and Asp residues are shown in purple stick representation. The three Arg residues that can form strong ion-ion interactions with ligands are labeled. The figure was generated using the Discovery Studio molecular simulation package.61
