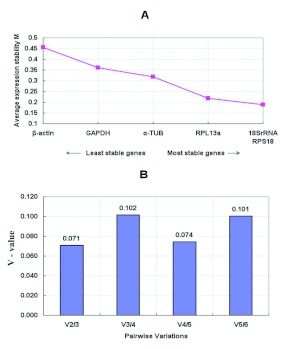
Figure 1.
Average expression stability of housekeeping genes tested in different strains of Tetranychus cinnabarinus in this study. (A)The average expression stability value, M, was determined using the geNorm program. After removal of the least stable housekeeping gene, the M values of remaining housekeeping genes were recalculated until the last two pairs could not be further compared. Housekeeping genes in order of increasing stability are ranked from left to right, which are indicated by lower M values. (B) Determination of the optimal number of control genes for normalization. Pairwise variation analysis to determine the optimal number of reference genes needed for accurate normalization in V-values less than 0.15 indicates no further genes are needed for calculation of a reliable normalization factor. High quality figures are available online.

