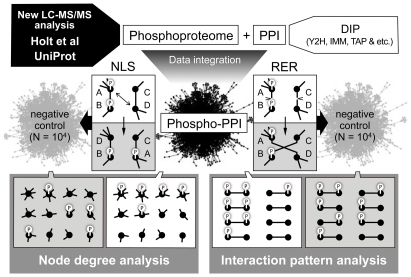
Figure 1. Overview of integrative analysis of yeast multi-omics data.
New phosphoproteins were identified by LC-MS/MS analysis and unified with the publicly available phosphoproteome datasets of Holt et al. [16] and UniProt [19] (Step 1). A protein–protein interaction (PPI) map was obtained from DIP (Database of Interacting Proteins) [33] (Step 2). Y2H, yeast two-hybrid; IMM, co-immunoprecipitation; TAP, tandem affinity purification. The “phospho-PPI” map was generated by superimposing the phosphoproteome data onto the PPI map (Step 3). Negative controls for the phospho-PPI map were generated by “node label shuffling (NLS)” and “random edge rewiring (RER)” (Step 4). Comparative analyses of the real phospho-PPI and its negative controls were performed with other yeast multi-omics data (Step 5).

