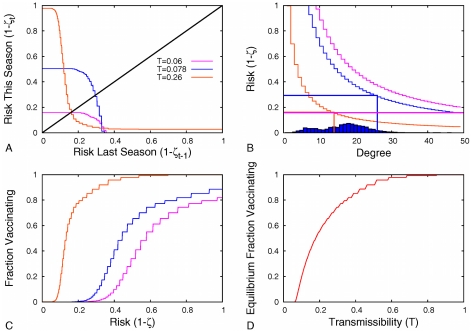
Figure 3. The effect of transmissibility on risk and vaccination dynamics.
(A) The effect of transmissibility (T) on inter-seasonal change in risk in the urban network. Equilibria occur at intersections with black ( ) line. (B) As the transmissibility increases, the equilibrium vaccination threshold and risk change non-monotonically. For low T (
 , magenta) the equilibrium level of risk is less than 0.2 per year, and the vaccination threshold is greater than the maximum degree in the network. Consequently, nobody in the population is expected to vaccinate. For intermediate T (
 , blue), the equilibrium risk is near 0.5 per year and only a small fraction of the most connected individuals vaccinate. At high T (
 , orange), a large fraction of individuals vaccinate, leaving an intermediate level of risk. (C) As both risk and transmissibility increase, vaccination behavior increases. (D) Consequently, the equilibrium level of vaccination is an increasing function of the transmission rate.

