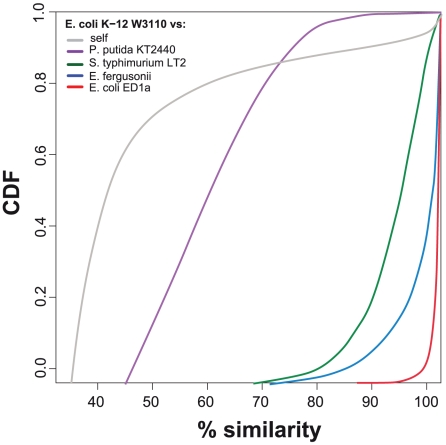
Figure 7. Cumulative distribution function plot of protein similarity.
Colored lines correspond to CDF plots of the similarity between orthologous proteins of the core genome for the comparison of E. coli K12 W3110 with genomes of increasing phylogenetic distances. The gray line corresponds to the similarity between homologous genes in the E. coli K12 W3110 genome.

