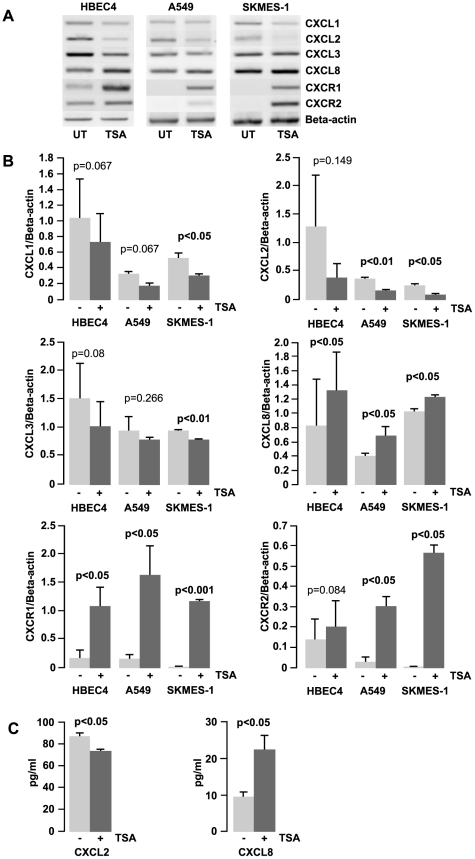
Figure 3. Cell line response to histone deacetylase inhibition.
A) The effect of TSA treatment (250 ng/mL for 16 h) on the expression of CXCL1–3, CXCL8 and CXCR1/2. B) Densitometry analysis of expression in treated versus untreated samples when normalised to beta actin. Data is graphed as mean ± standard error of mean (n = 3). C) Treatment with TSA also effects the production of CXCL2 and CXCL8 at protein level in SKMES-1 cells. Chemokines were quantified in conditioned media removed from culture after exposure to TSA (250 ng/mL for 16 h). Data is graphed as mean ± standard error of mean (n = 3). (UT – untreated, TSA – Trichostatin A).

