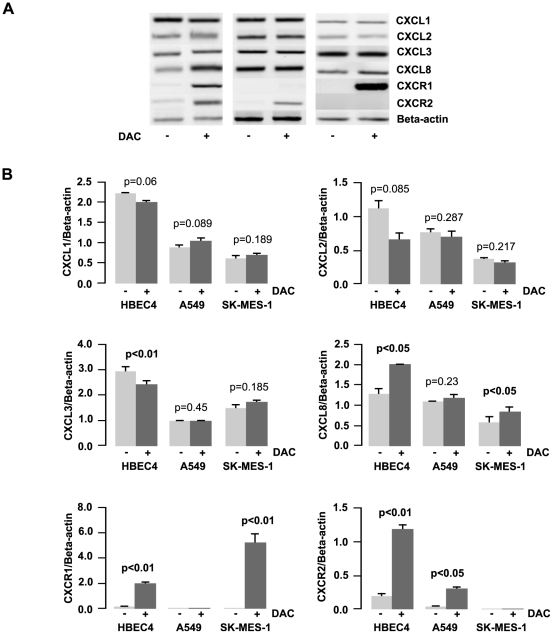
Figure 5. Cell line response to a DNA methyltransferase inhibitor.
A) The effect of 5-aza-2′deoxycytidine (DAC) treatment on the expression of CXCL1–3, CXCL8 and CXCR1/2. Cells were cultured in 1 µM DAC for 48 h with media and drug replaced every 24 h. Expression changes were measured using RT-PCR with Beta-Actin used as the internal control for quantification purposes. B) Densitometry analysis of expression in treated versus untreated samples when normalised to beta actin. Data is graphed as mean ± standard error of mean. (n = 3). (DAC – 5-aza-2′deoxycitidine).

