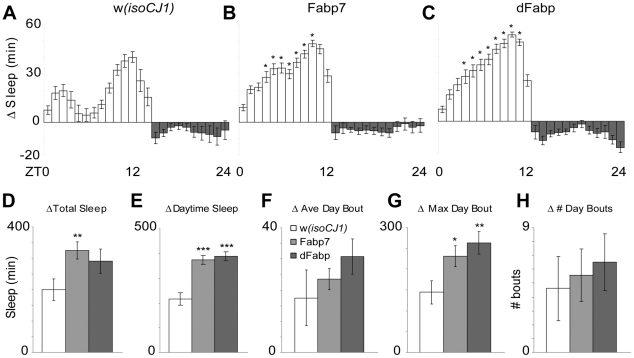
Figure 4. Increased net sleep in Fabp7 and dFabp overexpressing flies.
Hourly change in sleep profile of the (A) w(isoCJ1) background strain, (B) Fabp7, and (C) dFabp flies shifted from 20°–30°C. Open bars = lights on, filled bars = lights off. Analysis of change in various sleep parameters of flies shifted from 20°–30°C: (D) Total sleep over 24 hours, (E) Total daytime sleep, (F) Average daytime sleep bout length, (G) Maximum daytime sleep bout length, (H) Number of daytime bouts. Open bars = w(isoCJ1), light grey bars = Fabp7, dark grey bars = dFabp. Results are mean ± s.e.m.; n = 20–30. Single asterisk, P<0.05; double asterisk, P<0.01; triple asterisk, P<0.001, t-test.

