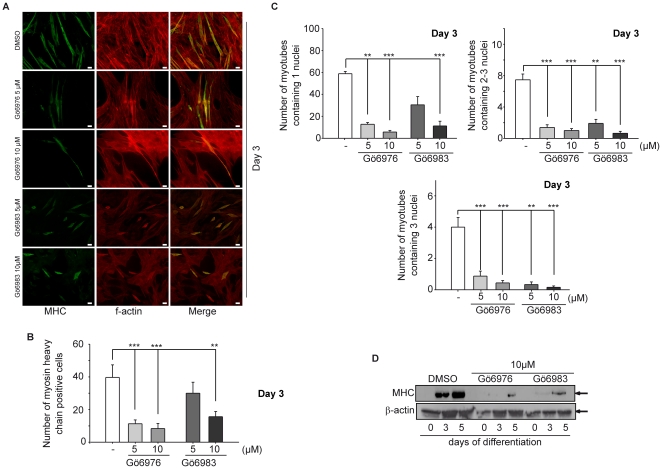
Figure 4. Pharmacological inhibition of PKCs and PKDs inhibits myoblast differentiation in vitro.
(A) Cells were seeded on cover slips and treated with either Gö6976 or Gö6983. Concentrations are indicated in the figure. DMSO served as a solvent control. On day 3, cover slips were stained for MHC (green), F-actin (red) and nuclei (blue). Photographs are representative for 3 independent experiments. Scale bars, 20 µM. (B) Number of myotubes or MHC-positive cells per visual field. Ten randomly selected visual fields were photographed and the number of MHC positive cells was plotted as indicated in the figure. P<0.05 (*), p<0.01 (**) and p<0,001 (***). (C) Fusion indices for inhibitor (Gö6076 and Gö6983) treated cultures in comparison to solvent controls are shown. Concentrations are indicated in the figure. Fusion indices were calculated as the number of nuclei per myotube and sub-classified as 1 nucleus per myotube (upper left panel), 2-3 nuclei per myotube (upper right panel) or more than 3 nuclei per myotube (lower panel). Ten randomly selected visual fields were evaluated. P<0.05 (*), p<0.01 (**) and p<0.001 (***). (D) Immunoblot analysis for MHC in differentiating C2C12 cells. Cultures were treated with inhibitors (Gö6076 and Gö6983) as indicated. One representative immunoblot out of two is shown.

