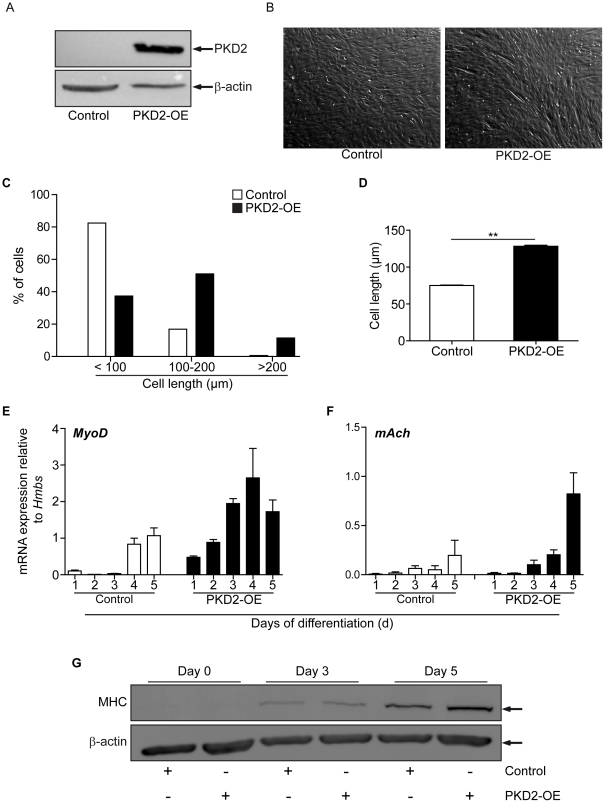
Figure 6. Ectopic expression of PKD2 increased myogenic differentiation.
(A) C2C12 cells were infected with retroviruses encoding for either EGFP or PKD2 according to material and methods After infection cells were selected for one week with neomycin to generate stable and pure cell lines and analyzed via immunoblot for expression of the viral PKD2-transgene. To avoid overexposure and interference with the neighbouring band a short exposure time was chosen in purpose. (B) Representative bright field view of control virus transduced C2C12 cells (left photograph) and PKD2 overexpressing C2C12 cells (right photograph) are shown. Scale bars, 20 µM. (C) The percentage of cells in the respective group was calculated with the following total numbers of counted cells: control, n = 2421; PKD2-OE, n = 2090 (n = 3). Cells were grouped according to their cell length (<100, 100–200, >200 µM). Numbers of cells per group were as follows: <100: 82% vs. 37%; n = 1996 vs. n = 782. 100–200 µM: 16% vs. 51%; n = 408 vs. n = 1067. >200 µM: 0.6% vs. 11%; n = 16 vs. n = 240. (D) Calculated means of all measured cells belonging to either control or PKD2-OE cells are shown. (E and F) qPCR analysis for MyoD (E) and mAch (F) expression in stable C2C12 cells during differentiation at indicated time points. (G) Control cells and PKD2 transduced cells were differentiated and collected as indicated in the figure. Subsequent immunoblot analysis revealed increased MHC expression in knock down cells. One representative immunoblot is shown.

