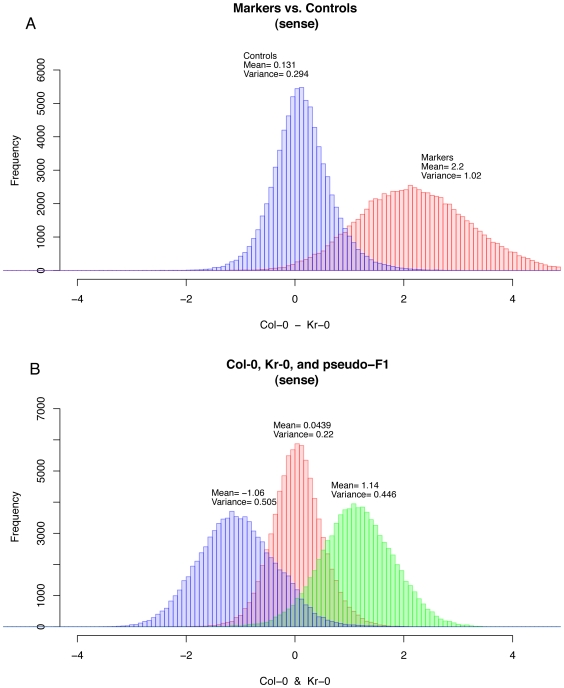
Figure 1. Probe signal distributions.
(Top) Histograms of the difference in allele signals (Col-0 allele probe – other allele probe) of sense strand signals between the Col-0 and Kr-0 parent arrays for probe sets marked by the Atwell et al. [12] as polymorphic (markers) and not marked as polymorphic (controls). (Bottom) Histograms of the allele signals from the parent arrays and the pseudo-F1 array constructed from the mean of the parent arrays. The pseudo-F1 array signals are distributed about zero, as would be expected for an actual heterozygous plant.

