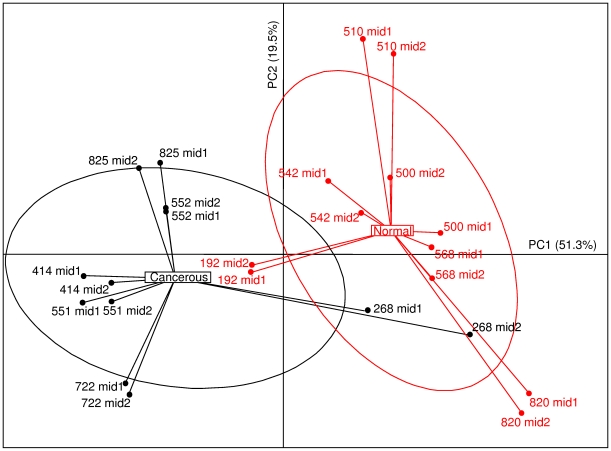
Figure 1. Bacterial genera abundance differentiates cancer patients and normal colonoscopy individuals.
Principal component analysis, based on the 16S rRNA gene sequence abundance of 7 discriminates genera which represented at least 1% of microbiota abundance, was carried out with 6 healthy individuals (N) and 6 cancer* patients (Ca) with two replicates (noted as mid1 and mid2). Two first components (PC1 and PC2) were plotted and represented 70.83% of whole inertia. Individuals (represented by their sample id) were clustered and centre of gravity computed for each class. * They all have been selected from stage I-II of TNM classification (see also Tables S2 and S3 and Figures S2&S3 in the supplementary File S1).

