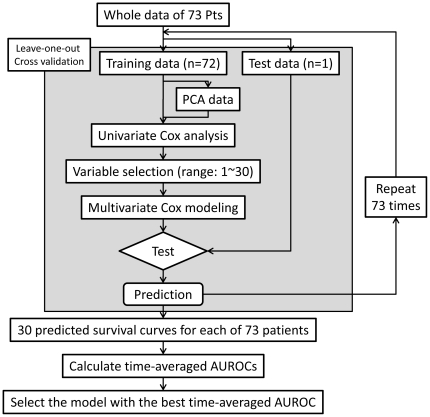
Figure 1. Flow chart of the prediction model construction and validation.
To establish prediction models, the leave-one-out cross-validation method (LOOCV), principal component analysis (PCA), and Cox proportional hazard (CoxPH) models were used. In each LOOCV cycle, the variables of the training datasets or principal component (PC) dataset were prioritized by univariate CoxPH model analysis. Next, multivariate CoxPH models were developed using 1∼30 top-ranked variables, and 30 predicted recurrence-free survival curves were the output for a test dataset. After 73 LOOCV cycles, 73×30 predicted recurrence-free survival curves were generated. For each number of variables used, the time-averaged AUROC was calculated using a set of 73 predicted survival curves. Finally, a model with the best time-averaged AUROC was selected.

