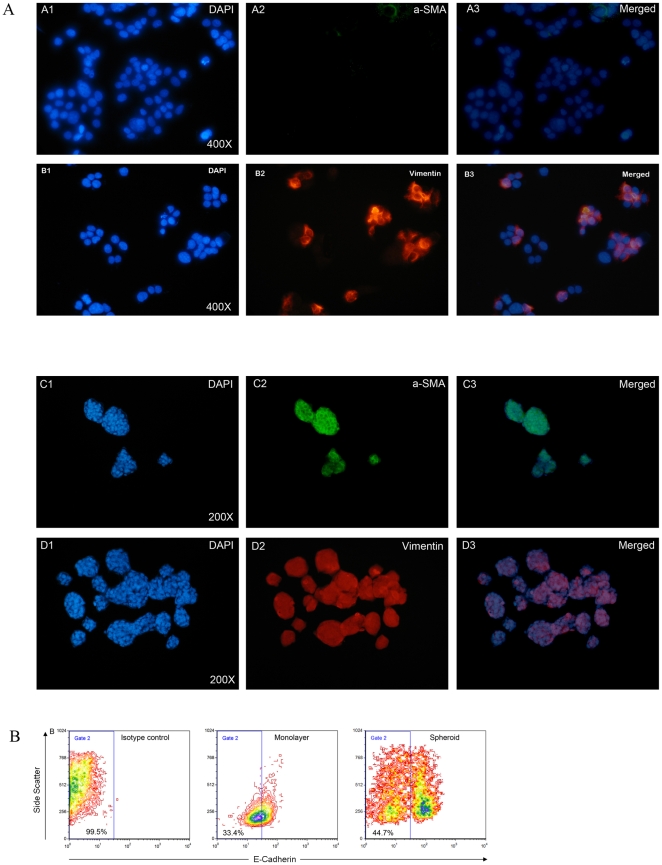
Figure 7. Analysis of the expression of α-SMA and Vimentin expression by immunofluorescence and E-Cadherin by FACS of monolayer versus SDC.
(A) Immunofluorescence staining of monolayer (A1-3 and B1-3) and spheroid (C1-3 and D1-3) cultures from UT-SCC24A with antibodies directed against α-SMA (green) and Vimentin (red). All of the SDC (panel C and D) show high levels of the mesenchymal markers α-SMA and Vimentin compared to their monolayer counterparts. (B) E-Cadherin expression analysis by FACS. Compared to their monolayer counterparts, spheroids showed decreased E-Cadherin expression; two populations of cells derived from UT-SSC24A can be separated according to the E-Cadherin expression level, which indicates that the SDC have acquired myofibroblast characteristics by EMT.

