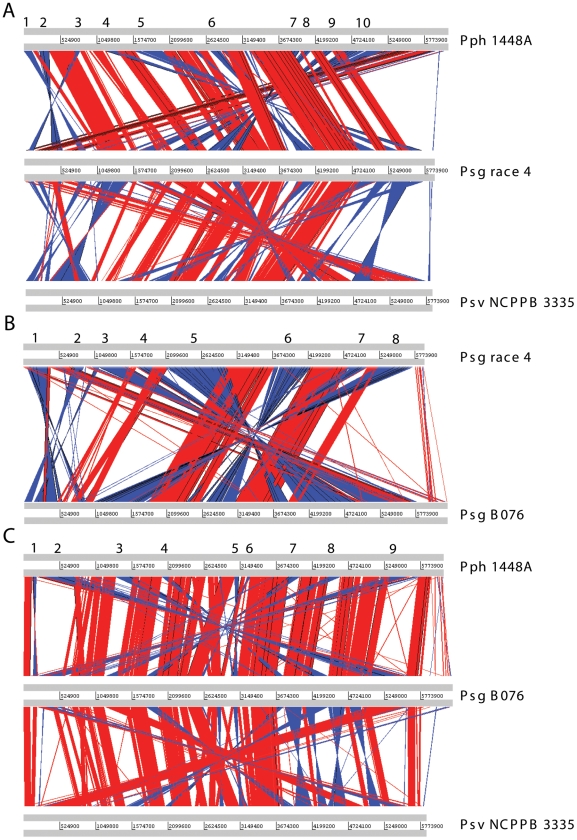
Figure 3. Pairwise alignments between the draft genomes of Pseudomonas savastanoi pv. glycinea strains and the genomes of Pph 1448A and Psv NCPPB 3335.
BLASTN analyses were performed using WebACT and displayed with the ACT software. The red bars indicate collinear regions of similarity, and the blue bars indicate regions of similarity that are inverted in their relative orientations. Only matches larger than 3 kb are shown. (A) Psg race 4 against Pph 1448A and Psv NCPPB 3335; (B) Psg race 4 against B076; (C) Psg B076 against Pph 1448A and Psv NCPPB 3335. Numbers indicate major inversions in the genomes of Psg strains with respect to Pph 1448A.

