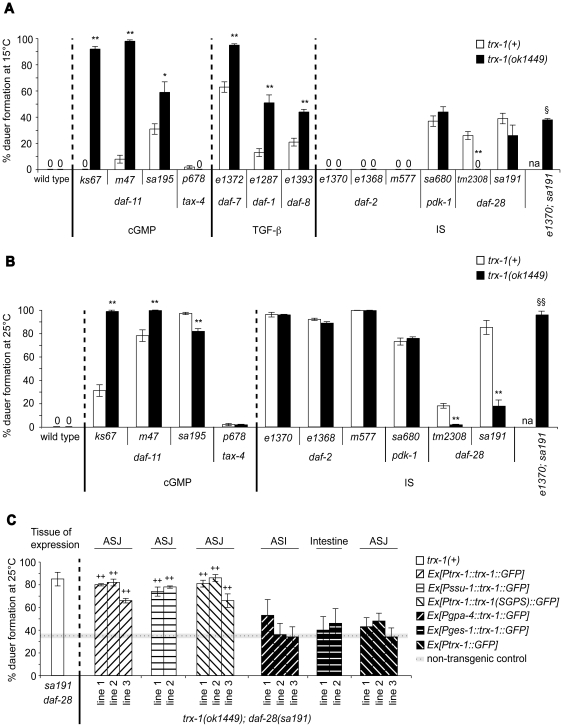
Figure 1. Redox-independent functions of TRX-1 in ASJ neurons modulate DAF-28 signaling during dauer formation.
Dauer formation at 15°C (A) and 25°C (B) is shown for each of the daf-c mutant alleles tested in a trx-1(+) wild-type background (white bars) or in combination with a trx-1(ok1449) deletion null mutant allele (black bars). (C) Rescue of the suppression of the Daf-c phenotype in trx-1(ok1449); daf-28(sa191) transgenic animals (patterned bars) expressing either Ptrx-1::trx-1::GFP, Pssu-1::trx-1::GFP, Ptrx-1::trx-1(SGPS)::GFP, Pgpa-4::trx-1::GFP, Pges-1::trx-1::GFP or Ptrx-1::GFP. The cellular site of expression for each transgenic extrachromosomal array is outlined above the graph in panel C. The non-transgenic control represents the average of all assays performed with non-transgenic progeny that segregated from the same transgenic parents (dotted line) ± standard error of the mean (SEM, horizontal gray line). The white bar corresponding to the daf-28(sa191) single mutant in panel C, has been taken from panel B for comparison. In all three panels, each bar represents the average of 2–3 independent assays ± SEM, with more than 165 animals assayed in total per genotype. * p<0.05, ** p<0.01, § p<0.05 relative to trx-1(ok1449); daf-28(sa191), §§ p<0.01 relative to trx-1(ok1449); daf-28(sa191), and ++ p<0.001 relative to non-transgenic animals, by chi-squared test (see also Tables 1, 2 and 3). na: not assayed. The molecular identities of all mutant alleles presented here are shown in Table S1.

