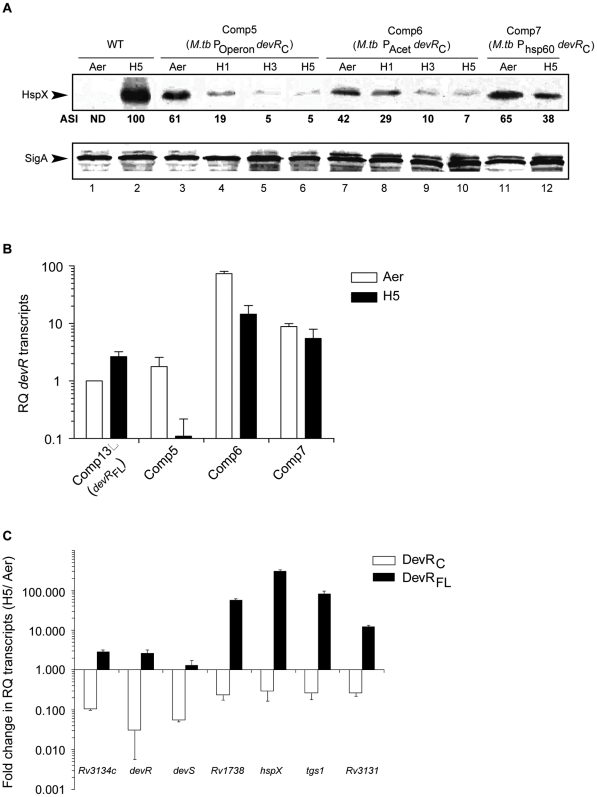
Figure 4. DevR regulon expression in DevRC-expressing cultures declines during hypoxia.
(A) M. tb lysates (15 µg protein) were immunoblotted using rabbit anti-HspX or anti-SigA polyclonal sera and the blots were analyzed using Quantity One software (Bio-Rad, USA). The normalised intensities of the HspX-derived signals (with respect to those of SigA) are denoted as Arbitrary Signal Intensities (ASI) with respect to those obtained in 5 days hypoxic WT cultures (H5). ‘Aer’, aerobic; H1 H3 and H5 refer to 1, 3 and 5 days hypoxic cultures, respectively; ND, not detected. (B) Relative Quantity (RQ) of devRC transcripts in different Comp strains determined by real time RT-PCR analysis. (C) Real time RT-PCR analysis of DevR regulon transcripts. Fold change in the relative quantity of transcripts under ‘hypoxic’ vs. ‘aerobic’ conditions (fold decrease in Comp5 and fold increase in Comp13) is shown.

