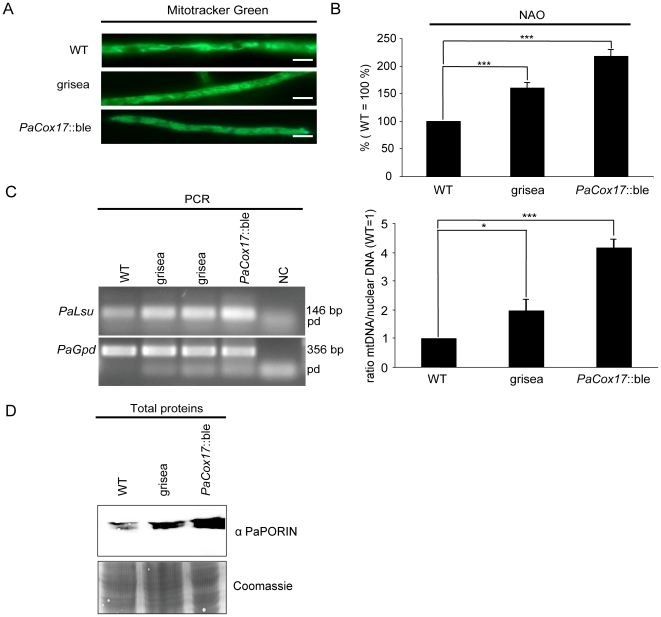
Figure 3. Mitochondrial content.
A Mycelia were stained with Mitotracker Green and analysed by fluorescence microscopy. Representative hyphae are shown. Scale bar: 2 µm. B Protoplasts prepared from mutants grisea and PaCox17::ble contain significantly more mitochondria than the WT as revealed by NAO staining. Mitochondrial content in the WT was set to 100%. C Determination of the mtDNA/nuclear DNA ratio as a marker for mitochondrial quantity by PCR. left: representative 1% agarose gel showing separated PaGpd (nuclear DNA) and PaLsu (mtDNA) amplification products stained with ethidiumbromide, NC: negative control, pd: primer dimers. right: densitometric analysis of band intensities. The mtDNA/nuclear DNA ratio in the WT was set to 1. D Western blot analysis to detect PaPORIN levels in total protein extracts from the wild type strain and the two mutants. As a loading control the Coomassie-stained transfer membrane is shown. Data represent mean ± standard error. *: p<0.05; ***: p<0.001, Student's t test, two-tailed.

