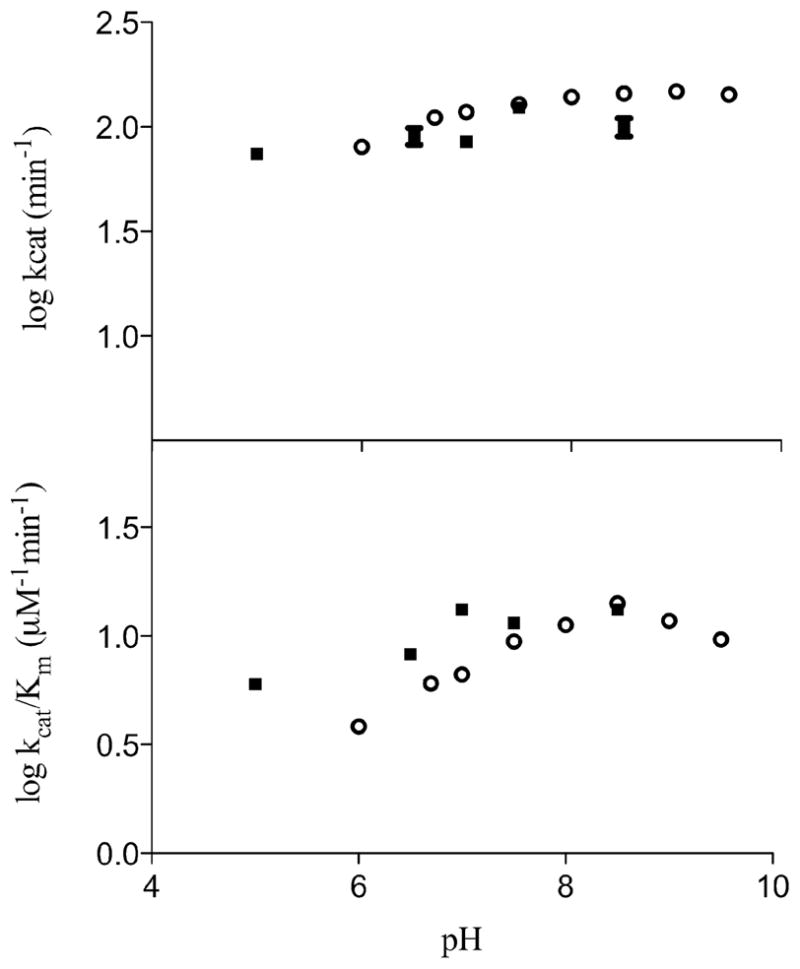
Figure 1.

The pH profile of PncA with nicotinamide as the substrate. Log kcat vs pH (top), Log kcat/Km vs pH (below). All data points represent the mean of at least three separate sets of experiments. Black squares are values collected from the end point HPLC assay method, open circles represent data collected with the enzyme coupled assay method.
