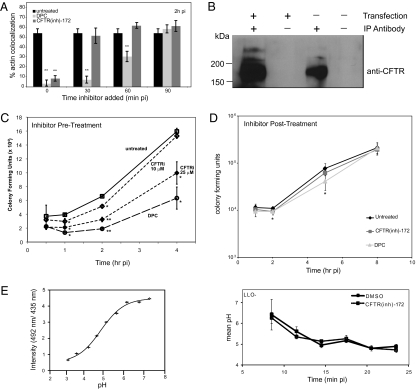
Fig. 1.
Host chloride channels contribute to Listeria vacuolar escape. (A) RAW cells were infected with Listeria and left untreated or treated with CFTR(inh)-172 or DPC at the indicated times pi. Cells were fixed at 2 h pi, stained with rhodamine-phalloidin and anti-Listeria antibody, and analyzed by epifluorescence microscopy. Percentages represent number of bacteria per 100 colocalized with actin compared with untreated; the same untreated sample is shown with each time point of inhibitor addition (n = 3). (B) Endogenous or transfected CFTR was immunoprecipitated from RAW cells in the absence or presence of CFTR antibodies and immunoblotted with anti-CFTR antibody. (C) RAW cells were left untreated or pretreated for 1 h with the indicated concentrations of CFTR(inh)-172 or DPC. Cells were then infected with Listeria, and colony forming units (CFU) were enumerated at indicated times pi. (D) RAW cells were left untreated or treated with CFTR(inh)-172 or DPC at 1 h pi. Macrophages were infected with Listeria, and CFU were enumerated at indicated times pi. (E) Calibration curve of Oregon Green 492 nm/435 nm ratio plotted against pH (Left), and measurement of pH over time in Listeria-containing vacuoles (Right). RAW cells were pretreated with CFTR(inh)-172 or DMSO and infected with LLO− Listeria for 5 min. Cells were washed, and images were acquired at 2.5-min intervals over the 25 min after infection (≥90 vacuoles per condition). Mean pH represents AF of Listeria-containing vacuoles excited at 500 nm divided by AF of vacuoles excited at 435 nm based on a standard curve. For all graphs, *P < 0.05 and **P < 0.001, comparing untreated and treated cells. Data shown are representative of at least three independent experiments.

