Fig. 1.
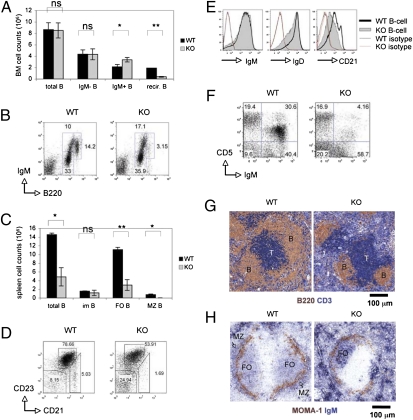
B-cell maturation. (A and B) Decreased recirculating B cells. (A) BM cellularity histogram shows total B220+ B cells (total B), B220+IgM− B-cell progenitors (IgM− B), B220lowIgM+ immature B cells (IgM+ B), and B220highIgM+ recirculating B cells (recir. B). For all figures, data are the mean ± SD of triplicates and/or represent two to three independent trials (*P < 0.05; **P < 0.005; ns, not significant). All data were collected from mice of 8 and 16 wk. (B) FACS of IgM versus B220 by the cells in A. For all FACS profiles, data reflect the gating of 10,000 lymphocytes. Numbers are percentages of B220+IgM− progenitor, B220lowIgM+ immature and B220highIgM+ recirculating B cells. (C and D) Decreased splenic B cells. (C) Splenic cellularity histogram showing total B220+ B cells (total B), B220+CD21−CD23− immature B cells (im B), B220+CD21lowCD23high FO B cells (FO B), and B220+CD21highCD23low MZ B cells (MZ B). (D) FACS of CD23 versus CD21 of the cells in C. Numbers are percentages of CD21−CD23− immature B cells, CD21lowCD23high FO B cells, and CD21highCD23low MZ B cells. (E) Decreased CD21 expression. FACS of B-cell IgM, IgD, and CD21 expression. (F) Reduced peritoneal B cells. FACS of CD5 versus IgM by peritoneal B cells. (G and H) Altered splenic microarchitecture. (G) IHC staining of spleens with anti-B220 (brown) plus anti-CD3ε (blue). (H) IHC staining of spleens with anti–MOMA-1 (brown) plus anti-IgM (blue).

