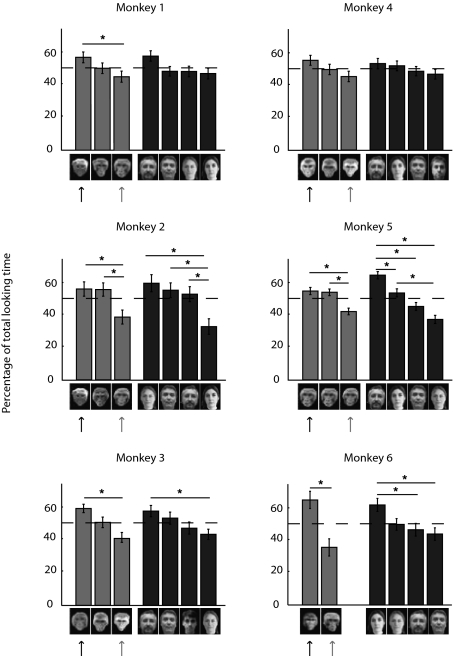
Fig. 3.
Preferential looking time across individual pictures for each tested subject. Mean percentage of looking time is shown for each face picture within a pair. The dashed line indicates chance expectation. Errors bars represent SEM. Intragroup comparisons were calculated using a multiple-comparison test with a Bonferroni adjustment (*, 95% confidence intervals). Solid arrows indicate pictures of the closest monkey to each tested subject. Shaded arrows indicate pictures of the most agonistic monkey to each tested subject.

