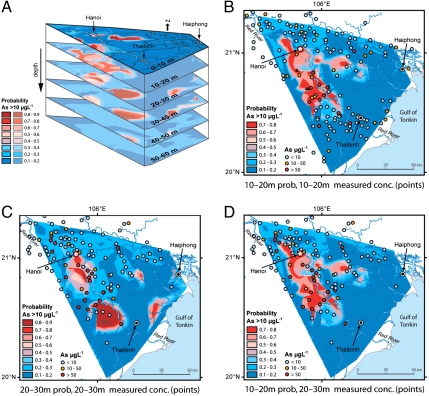
Fig. 4.
Risk of As pollution plotted in three dimensions and at 10 m depth intervals. (A), three-dimensional distribution of As exceeding 10 μgL-1, stacked at 10 m depth intervals (see also Fig. S8). (B), Average probability and measured As concentrations at a depth of 10–20 m [mean sea level (m.s.l.)]. Model classification results based on a probability cut-off value of 0.4 are: 84% correctly classified, 3% false-positive (As < 10 μgL-1 in high-risk areas), and 13% false-negative (As > 10 μgL-1 in low-risk areas). (C), Average probability and measured As concentrations at a depth of 20–30 m (m.s.l.). Classification results are: 72% correct, 3% false-positive, and 25% false-negative. (D), Average probability and measured As concentrations at a depth of 10–20 m (same probability data as in Fig. 4B) overlain by As concentrations from 20–30 m. Classification results are better than those for Fig. 4C: 74% correct, 9% false-positive, and 17% false-negative.

