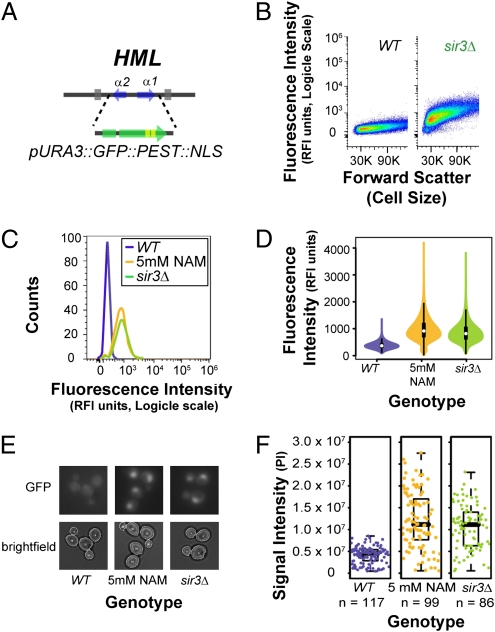
Fig. 1.
The expression status of HML visualized using fluorescent markers. (A) A gene encoding a nuclear-localized, destabilized version of GFP expressed from the URA3 promoter was integrated into the HML locus replacing α1 and α2 genes. (B) Fluorescence intensity of cells containing the hml::GFP reporter in either SIR3 or sir3Δ backgrounds was measured using a flow cytometer. Fluorescence intensity is plotted against forward scatter, a measurement proportional to cell size. (C) Fluorescence intensity measurements of cells containing an hml::GFP reporter are shown as a scaled histogram. Both sir3Δ and 5-mM nicotinamide profiles are shown. (D) The same information in C is here illustrated as “violin plots,” which are symmetrized kernel density plots with a small box plot illustrated inside them. In these plots, the wider the violin shape is at a given fluorescence intensity, the more cells are associated with that value. The white dot indicates the geometric mean of the full population and the thick and thin lines are a box plot. (E) Cells containing the hml::GFP reporter imaged by microscopy. (F) Signal intensities tabulated by quantitative microscopy for hml::GFP cells in three cultures.

