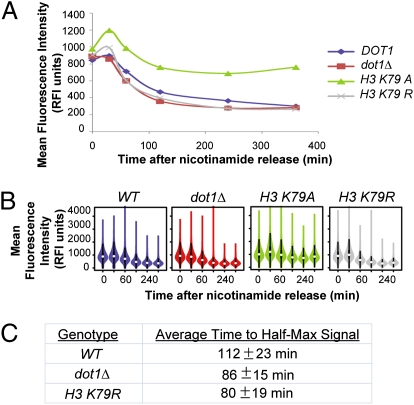
Fig. 4.
Dot1 antagonized silencing through H3 K79 methylation. (A) Wild-type cells (JRY9121), dot1Δ cells (JRY9123), cells containing H3 K79A histone mutations (JRY9125), and cells containing H3 K79R histone mutations (JRY9127) were grown in 5 mM nicotinamide and then rinsed of nicotinamide at the start of a time-course assay. The mean fluorescence intensity is plotted against time after release from nicotniamide. (B) Violin plots are illustrated to show the distributions. (C) The time to half-maximal signal intensity was calculated for each strain in each replicate and averaged over the three replicates.

