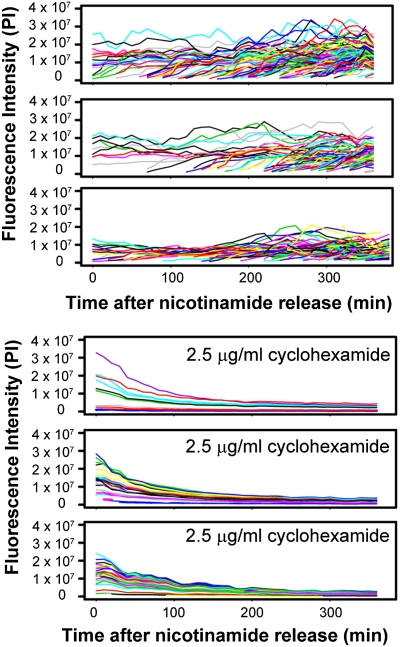
Fig. 5.
Transcriptional variation and GFP degradation. (Upper) To measure fluorescent variability over time, cells of the genotype hml::GFP::NLS::PEST sir3Δ (JRY9103) were measured for fluorescence intensity using quantitative microscopy. Traces of the fluorescence intensity of each cell are displayed as line plots where each line represents the intensity of a given cell over the time course. Three replicates are depicted. (Lower) To determine the degradation rate of the GFP fluorophore, hml::GFP::NLS::PEST sir3Δ cells (JRY9103) were exposed to 2.5 μg/mL cycloheximide 10 min before the start of a similar time course. The loss of fluorescence intensity over time is shown for three replicates. Fluorescence intensities are plotted in pixel intensity units.

