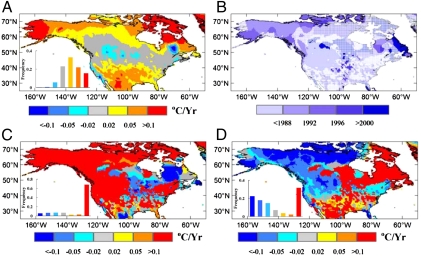
Fig. 1.
Spatial distribution of spring (April and May) temperature changes in North America. (A) Spring temperature trend during the whole study period 1982–2006, (B) the year corresponding to the turning point (TP) of spring temperature trend estimated by the piecewise linear regression approach, (C) spring temperature trend before the TP of spring temperature trend, and (D) spring temperature trend after the TP of spring temperature trend. White grids in B show area with insignificant (P > 0.10) TP. The insets show the frequency distributions of corresponding trends. The explanation (R2) of piecewise linear regression on the change in spring temperature is significant (P < 0.10) in 43% of the continent with the average R2 of 19%, which is about two times of average explanation (8%) derived from simple linear regression (26% of the area show significant explanation).

