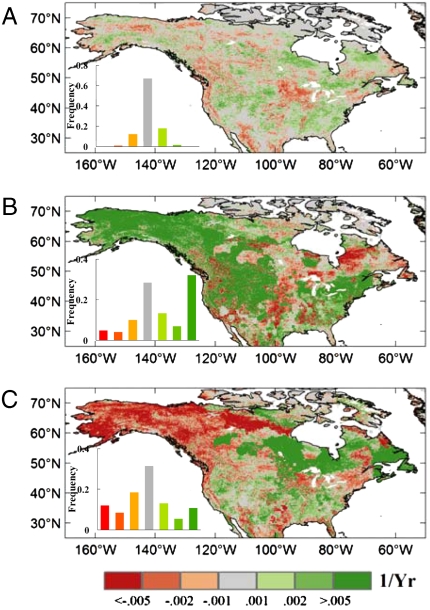
Fig. 2.
Spatial distribution of spring (April and May) NDVI change during different periods according to TP of spring temperature. (A) Spring NDVI trend during the whole study period 1982–2006, (B) spring NDVI trend before the TP of spring temperature trend, and (C) spring NDVI trend after the TP of spring temperature trend. The insets show the frequency distributions of corresponding trends.

