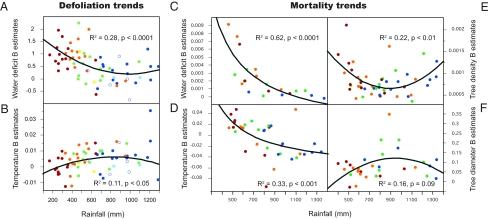
Fig. 3.
Geographical variation in the effects of water deficit and temperature on crown defoliation and mortality. Defoliation is modeled as a function of Emberger water deficit and temperature in generalized linear mixed first-order autocorrelative models for each species and each rainfall quartile. Similarly, mortality is modeled as a function of temperature, water deficit, tree density, and tree diameter using generalized linear models for each species and quartile. Significant β estimates for all tree species are plotted. (A) Changes in Emberger water deficit β coefficient values with increased rainfall for defoliation models. (B) Changes in temperature β coefficient values with increased rainfall for defoliation models. (C) Changes in Emberger water deficit β coefficient values with increased rainfall for mortality models. Note that the water deficit variable was square-transformed to account for hump-shaped responses detected in exploratory graphical analyses. (D) Changes in temperature β coefficient values with increased rainfall for mortality models. (E) Changes in plot tree density β coefficient values with increased rainfall for mortality models. (F) Changes in tree diameter β coefficient values with increased rainfall for mortality models. The red dots represent 0–25 quantiles; orange dots, 25–50 quantiles; yellow dots, 0–50 quantiles; green dots, 50–75 quantiles; dark-blue dots, 75–100 quantiles; light-blue dots, 50–100 quantiles; white dots, species of restricted geographical distribution.

