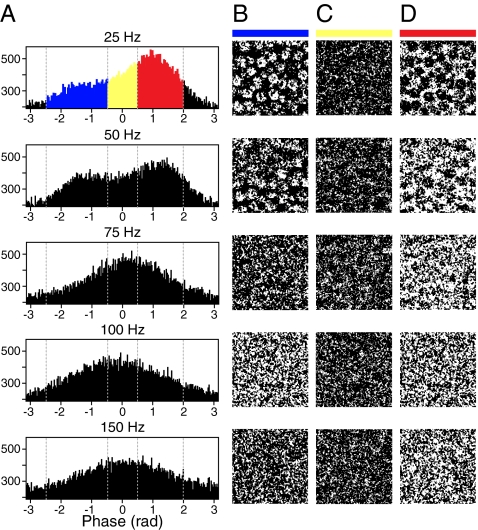
Fig. 3.
Spatial patterns of activity as a function of stimulus frequency and phase. (A) Histograms tabulate the phases for all pixels in one representative experiment with five frequencies of electrical stimulation. (B) A binary map of the spatial locations of pixels whose response phases fell between −2.5 and −0.5 rad clearly delineates the hair cells. (C) A similar map displays pixels with phases from −0.5 to 0.5 rad. (D) The pixels with phases from 0.5 to 2.0 rad are concentrated between the hair cells. The phase ranges are color-coded by the horizontal bars atop the columns; matching colors highlight data points in the phase histograms of A. The width of each image in B–D is 80 μm.

