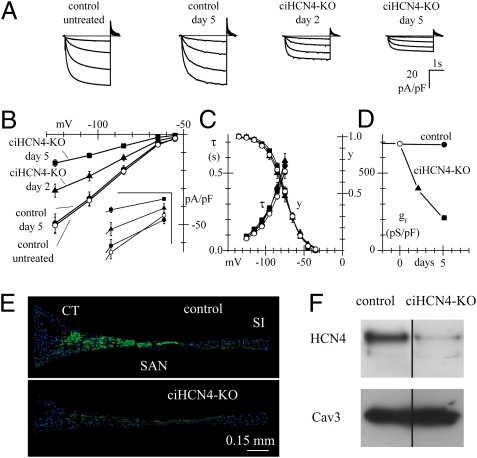
Fig. 4.
Reduction of HCN4 expression in pacemaker cells and tissue from ciHCN4-KO mice. (A) Representative If traces (normalized to cell capacitance) during steps to −65/−125 mV (20-mV intervals, holding potential −35 mV) from SAN cells isolated from a control and a ciHCN4-KO mouse at various times during the Tam procedure. (B) Mean steady-state current/voltage (I/V) curves recorded in control mice before (open circles, n = 44/9 cells/mice) and at day 5 (solid circles, n = 42/8) and in ciHCN4-KO mice at day 2 (solid triangles, n = 32/5) and day 5 of Tam treatment (solid squares, n = 42/7). (Inset) Data at −55 and −65 mV on an expanded scale (vertical bar 5 pA/pF; horizontal bar 10 mV). At all voltages, means of If current density of control untreated and control day 5 mice were not significantly different (t test, P > 0.05), and data were pooled together for further statistical analysis. Means of If current density from control, ciHCN4-KO day 2, and ciHCN4-KO day 5 mice were compared by one-way ANOVA followed by Fisher test (0.05 significance level), which showed that, for each voltage, the ciHCN4-KO day 2 mean is significantly different from the ciHCN4-KO day 5 mean and that both are significantly different from the control mean. (C) Mean If activation (y) and activation time constant (τ) curves measured in cells from the same groups as in B. Data points of activation curves were fitted with the Boltzmann equation. Half-activation voltages and inverse-slope factors, respectively, were the following: −75.0 mV, 11.2 mV (control untreated, n = 30); −75.1 mV, 11.1 mV (control day 5, n = 19); −74.2 mV, 10.1 mV (ciHCN4-KO day 2, n = 15); and −76.0 mV, 11.7 mV (ciHCN4-KO day 5, n = 11). Time constant curves were the mean from n = 15, n = 17; n = 12 and n = 7 for the same categories above, respectively. (D) Mean normalized If conductance (gf) measured from the data in B as the I/V slope in the interval −105/−125 mV. (E) HCN4 immunolabeling (green) of intercaval tissue slices obtained from representative control and Tam-treated ciHCN4-KO mice. Nuclei are labeled with DAPI (blue). CT, crista terminalis; SI, septum interatrialis. (F) Western blot of total SAN protein extracts (30 μg/lane) showing expression of the HCN4 protein in control and 4.5-d Tam-treated ciHCN4-KO mice. Cav3: loading control.

