Fig. 6.
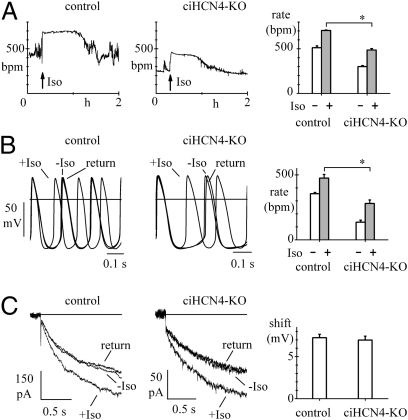
Response to β-AR stimulation. (A) Representative telemetry recordings from a control mouse (Left) and a ciHCN4-KO mouse (Center) at the fifth day of Tam treatment showing rate responses to the injection of Iso (arrows; Materials and Methods). (Right) Mean rates before and after Iso from control treated (n = 5) and ciHCN4-KO mice (n = 7). (B) Representative traces showing acceleration of spontaneous activity of two SAN cells from a control treated (Left) and a ciHCN4-KO mouse (center) exposed to 1 μM Iso. (Right) Mean spontaneous rates before and after Iso in cells from control treated (n = 6) and ciHCN4-KO mice (n = 10). (C) Action of 1 μM Iso on If recorded at −75 mV in SAN cells isolated from typical control (Left) and ciHCN4-KO mice (Center). (Right) Mean shifts of the If activation curve caused by 1 μM Iso in cells from control treated mice (n = 12) and ciHCN4-KO mice (n = 7). Asterisks in A and B indicate significant differences (P < 0.05). Records in B and C are before, during, and after Iso as indicated.

