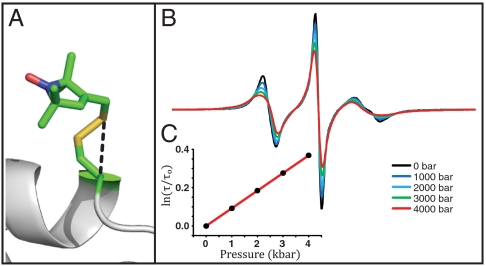
Fig. 2.
T4L 80R1. (A) Model of the R1 side chain in 80R1 based on the crystal structure (24). (B) Pressure dependence of the EPR spectra normalized to the same number of spins. (C) The nitroxide τ determined from fits to the spectra is plotted as indicated vs. pressure.

