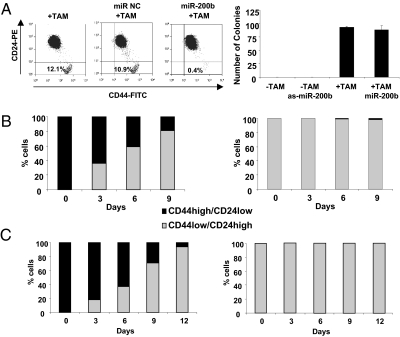
Fig. 3.
Relationship of CSC and NSCC formation and stability of the isolated cell types. (A) Transformation assays (morphology or colony formation in soft agar) of ER-Src cells that were or were not treated with TAM in the presence or absence of miR-200b or anti-sense miR-200b. (B) Number of CSCs (black) or NSCCs (gray) after growth of isolated CSCs (Left) or isolated NSCCs (Right) from ER-Src transformed cells for the indicated number of days. (C) Same as B except that sorted CSCs and NSCCs were derived from a breast tumor.

