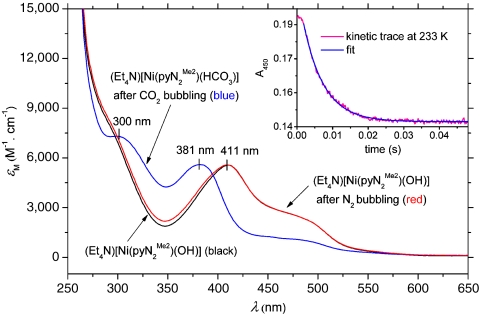
Fig. 1.
Absorption spectra in DMF: black trace— ; blue trace—after bubbling CO2 through the solution for 2 min; red trace—after vigorous bubbling of N2 through the solution of
  (blue trace) for 20 min. (Inset) Kinetics trace acquired at 450 nm and 233 K overlaid with a single exponential fit to A = A∞ + ΔA exp(-kobst), where A∞ is the absorbance after complete reaction, ΔA = A0 - A∞, A0 is the initial absorbance, and kobs is the observed rate constant. Reactant concentrations:
  , [CO2] = 1 mM.

