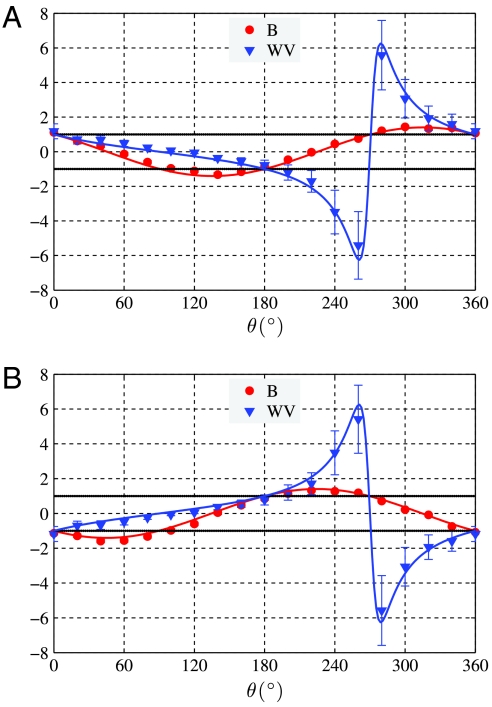
Fig. 3.
As for Fig. 2, except now K = 0.1598 ± 0.0091. Error bars are larger than in Fig. 2 because of poorer statistics due to reduced postselection probability. (A) B parameter formed with  . (B) B parameter from
  . Solid lines are the theoretical predictions from Eqs. 4 and 2. Bmax = 1.436 ± 0.053.

