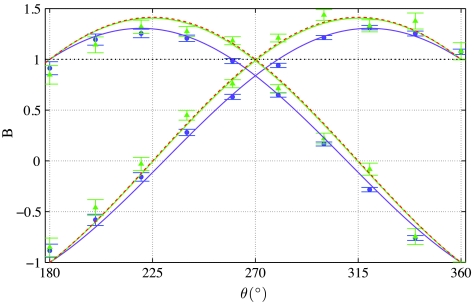
Fig. 4.
Comparison of the Leggett–Garg parameter (B) for a range of input states |σin〉, for the measurement strengths of Fig. 2, K = 0.5445 ± 0.0083 (•), and Fig. 3 K = 0.1598 ± 0.0091 (▴). As before, error bars show the standard deviation and arise from poissonian counting statistics. The range of violation of the LGI is larger when the measurement is less intrusive. The red dashed line is the theoretical result for a zero strength measurement, where the LGI would be violated for all states between |H〉 and |V〉. Note that even with a moderate strength of K = 0.1598 ± 0.0091, we cover most of this range.

