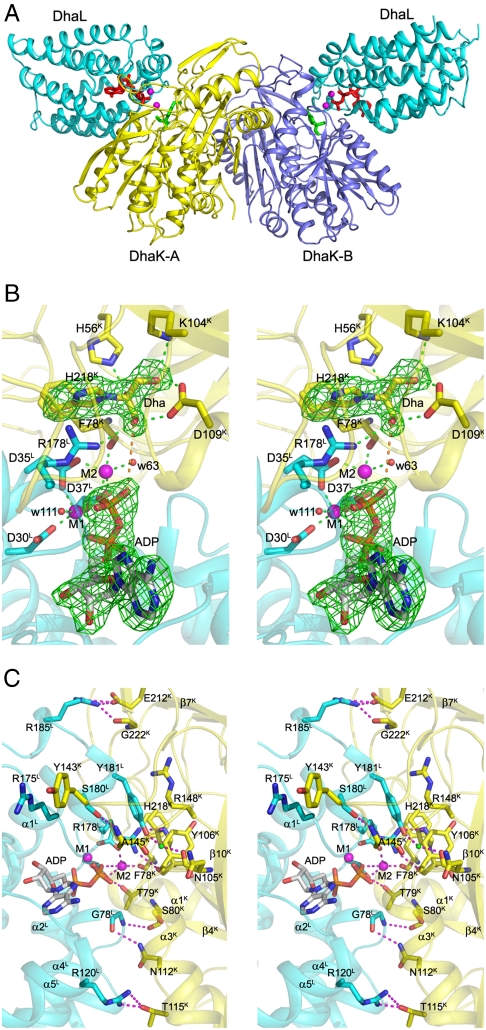
Fig. 1.
Crystal structure of the E. coli DhaK–DhaL complex. (A) Cartoon representation of the DhaK–DhaL heterotetramer. The DhaL molecules are shown in cyan with the two DhaK subunits A and B colored yellow and mauve, respectively. The Dha molecules covalently bound to His218K are colored green. The ADP molecules and magnesium ions bound to DhaL are shown as red sticks and magenta spheres, respectively. (B) Active site of the DhaK–DhaL complex. The DhaK (yellow) and DhaL (cyan) molecules are shown in cartoon representation. The ADP molecule and residues described in the text are shown in stick mode. The two magnesium ions are shown as magenta spheres. Interactions involving the Dha molecule and the two metal ions are indicated by green dashed lines. The distance between the γ-OH group of Dha and the oxygen atom of the ADP β-phosphate is 4.8 Å, which is shown as an orange dashed line. The difference (Fo - Fc) electron density map for Dha covalently linked to His218K as well as ADP (omitted from refinement) contoured at 4σ is shown in green. (C) Binding interface and interactions between DhaK and DhaL. The color scheme is the same as B. Hydrogen bonding interactions are shown as magenta dashed lines. The water molecule mediating the interaction between Y181L and N105K is shown as a green sphere.

