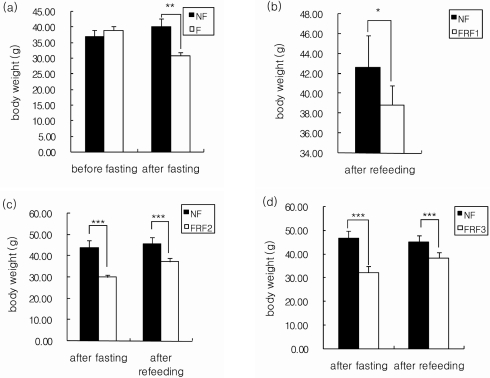
Fig. 4.
Body weights of mice. Mean ± SD of 6 mice per group. Indicates significantly different at *(P < 0.05), ***(P < 0.001) by Student's t-test NF; non fasting, F; fasting for 3days, FRF1; fasting for 3 days and then refeeding for 4 days repeated once, FRF2; fasting for 3 days and then refeeding for 4 days repeated twice, FRF3; fasting for 3 days and then refeeding for 4 days repeated three times.

