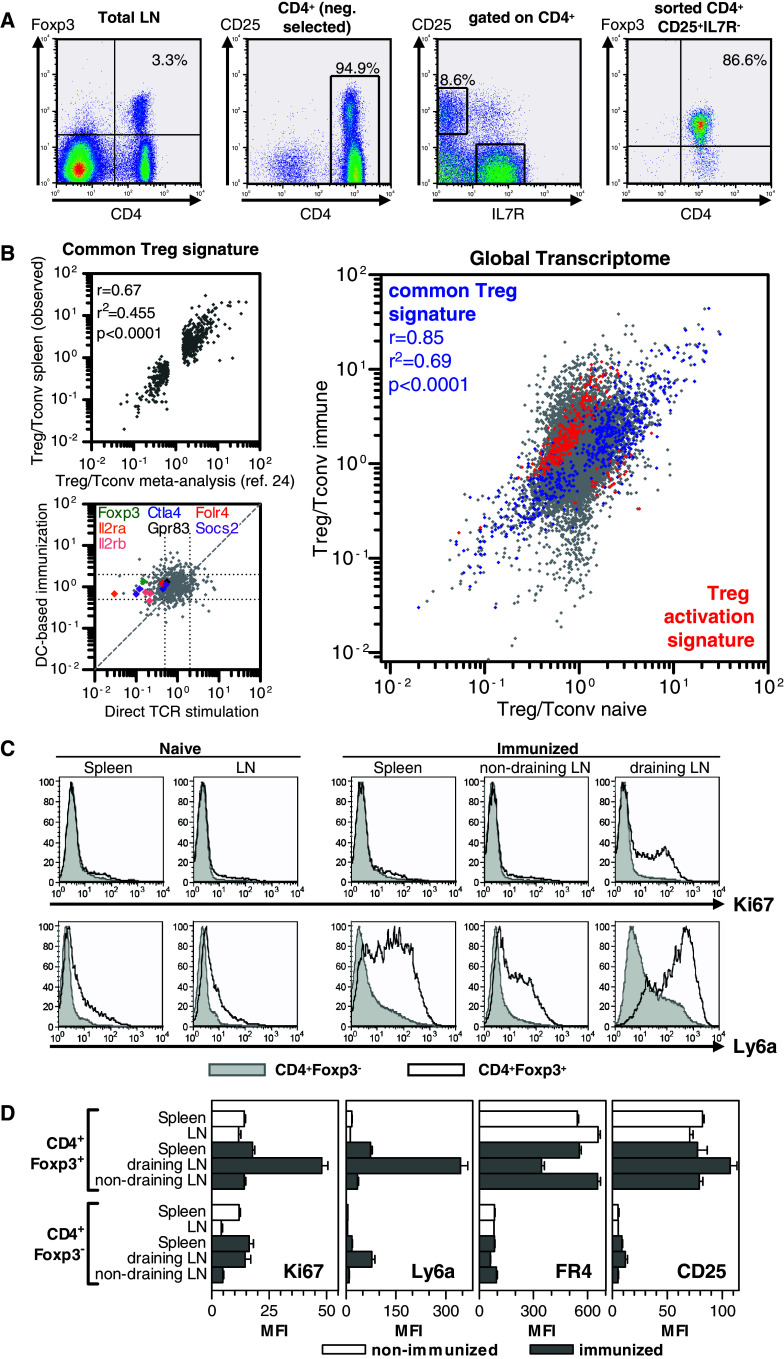
Fig. 2.
Gene expression profiling of Treg after DC-based peptide immunization. a Isolation of CD4+CD25+IL7R− Treg and CD4+CD25−IL7R+ splenocytes by flow cytometry. b Analysis of immunization-dependent changes in the Treg transcriptome. Left upper plot correlation of the common Treg signature [28] (x axis) with expression ratios of splenic naive Treg and Tconv in this study (y axis). Left lower plot comparison of induced changes in the common Treg signature under different stimulation conditions. A Treg stimulation index was calculated for every gene of the common Treg signature by dividing the expression ratio of stimulated Treg/stimulated Tconv through the expression ratio of naive Treg/naive Tconv. x axis Treg stimulation index derived from direct in vitro stimulation of TCR transgenic T cells with the cognate Ag [28]. y axis Treg stimulation index derived from splenocytes after in vivo DC-based immunization of wild-type mice with MHC class I-restricted peptide epitopes. Right panel influence of DC-based immunization on the global Treg transcriptome depicted by fold change versus fold change (FcFc) plot of expression ratios between Treg and Tconv from spleens of naive (x axis) and DC-immunized (y axis) mice. Blue dots indicate genes of the common Treg signature [28] Red dots indicate genes of a Treg activation signature defined by >/< twofold, highly significant (q < 0.01) immunization-induced expression difference in Treg and absence of a major expression difference (0.75–1.25fold change) in Tconv. c Expression of Ki67 and Ly6a in Treg and Tconv from various anatomical locations after J peptide immunization. d Summary of expression (mean and SEM) of selected proteins in Treg and Tconv. Non-immunized: n = 2 animals. Immunized: n = 6 animals (2 mice J immunized, 4 mice CDR3-immunized)

