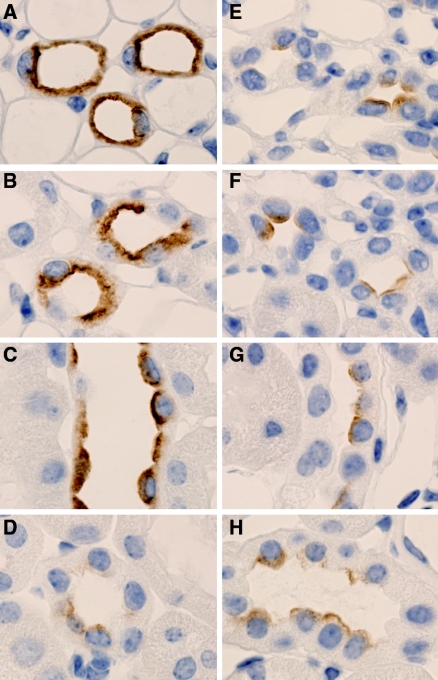
Figure 3.
Decreased AQP2 labeling in the CD of Li-treated control mice compared with Li-treated KO mice. (A through H) Immunohistochemistry using whole kidney sections from Li-treated CD-specific αENaC KO mice (A through D) and Li-treated control mice (E through H). Sections are incubated with anti-AQP2 antibody. In the IM (A and E), ISOM (B and F), and the CCD (C and G), AQP2 labeling is markedly reduced in the Li-treated control mice (E through G) compared with the Li-treated CD-specific αENaC KO mice (A through C). In the CNT, there are no changes in AQP2 labeling between the two groups (D and H).

