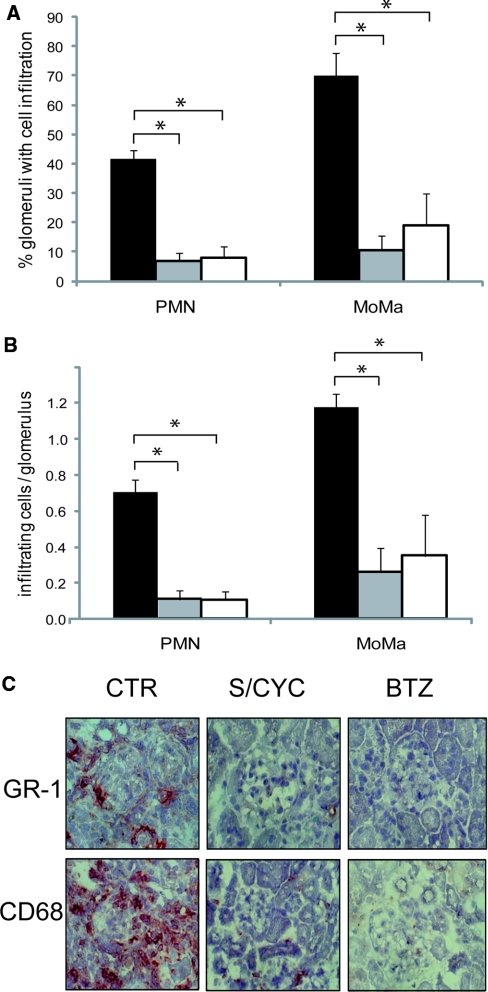
Figure 2.
BTZ and S/CYC treatments diminish glomerular PMN and macrophage influx. Panel (A) shows the percentage of glomeruli with PMN or macrophage infiltration and panel (B) the absolute number of these cells per glomerulus. Representative cross sections with GR-1 staining for PMN and CD68 staining for macrophages are depicted in panel (C). The groups consist of controls (CTR, black columns), S/CYC-treated mice (gray), and BTZ-treated mice (white). *P < 0.05.

