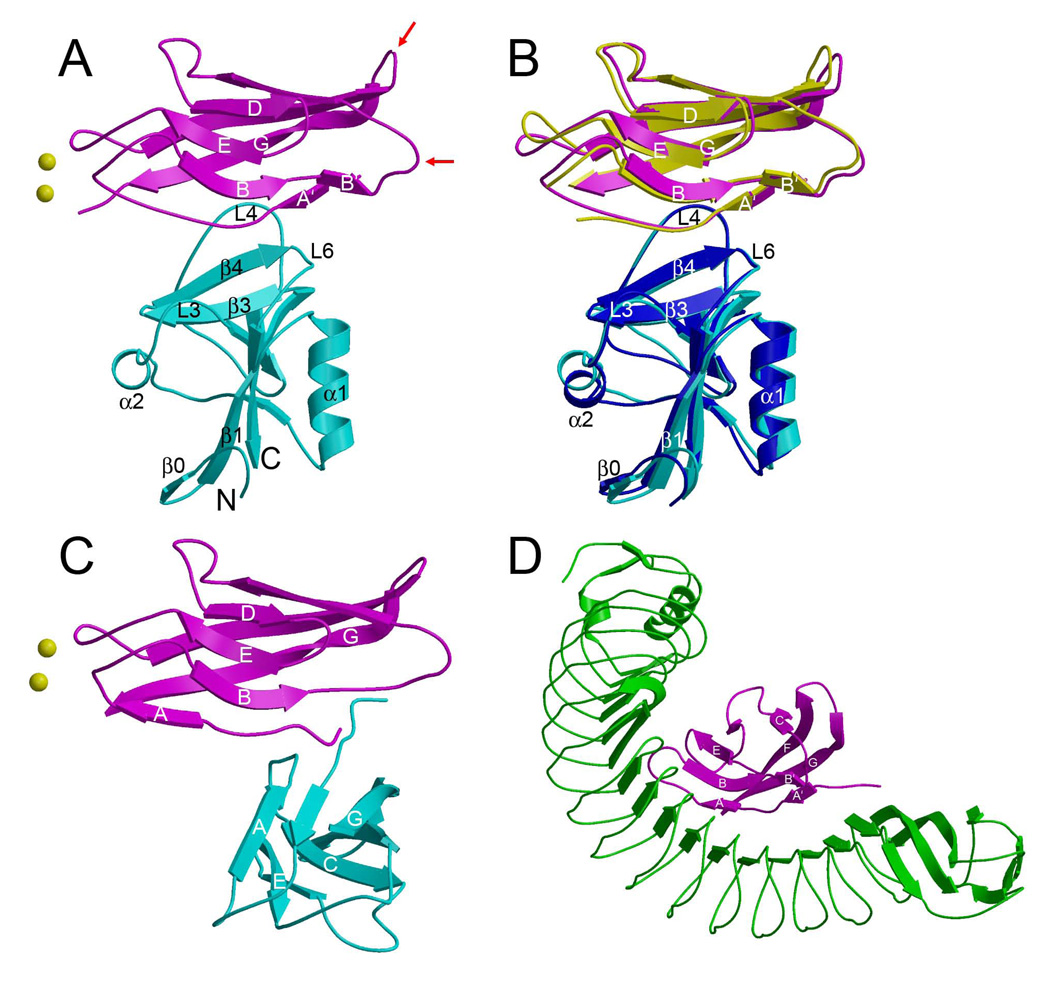
Figure 3. Structure of the KLRG1–EC1 Complex and Comparison with Other E-Cadherin Complexes.
(A) Structure of the mKLRG1–hEC1 complex. Mouse KLRG1 is cyan and hEC1 is purple. The N- and C-termini of KLRG1 are labeled. Bound Ca2+ ions are drawn as yellow spheres. Red arrows indicate the BC and FG loops of hEC1, which bind αEβ7 integrin (Taraszka et al., 2000).
(B) Superposition of the mKLRG1–hEC1 and hKLRG1–hEC1 complexes. In the hKLRG1–hEC1 complex, hKLRG1 is blue and hEC1 is yellow.
(C) Structure of the hEC1–hEC1 strand-swapped adhesion dimer (2O72). The orientation of the upper hEC1 monomer (purple) is similar to that of hEC1 in (A).
(D) Structure of the Listeria internalin–hEC1 complex (1O6S). The hEC1 domain (purple) bound to internalin (green) is oriented similarly to hEC1 in (A).

